
Technical guide · Computer vision and demand forecasting
People countingFrom camera footage to forecasts with YOLO26, tracking and TimesFM 3.0 on QDivZero
Use YOLO26 and QDivZero tracking to count arrivals and forecast footfall with TimesFM 3.0. A technical guide with WebSocket, Python, cURL and real screenshots.

Guide contents13 sections
Turn images from your physical business cameras into footfall metrics and forecasts. YOLO26 detects people and QDivZero tracking follows their movements. A counter turns those trajectories into arrivals, and TimesFM 3.0 uses the history to forecast the next hours. This guide connects those steps using models deployed on your GPU through QDivZero.
The workflow applies to any physical business with cameras that can observe its entrances: shops, gyms, cafés, restaurants and visitor venues. It helps you plan staffing, understand peak hours and anticipate the next day's visits. A forecast remains an estimate that needs checking against your own venue.
We use a restaurant as the worked example. Camera placement, opening schedules and activity patterns will change between businesses; detection, counting and forecasting follow the same stages.
We use a generated image and eight weeks of synthetic hourly arrivals. Download them to follow the workflow before connecting a camera. The image tests object detection; the synthetic history is generated separately and does not represent arrivals measured from that image. Screenshots show the actual QDivZero interface in Spanish.
What you will learn and what you need
By the end, you will be able to check YOLO26 with an image, enable QDivZero video tracking, turn its responses into hourly arrivals using Python and send the history to TimesFM 3.0. You will also export a forecast to CSV. The guide covers both the interface and requests from your application.
- To explore the example: Python 3.11 or later and the downloadable files. Read the saved results without an account, GPU or API calls.
- To run your own inference: a QDivZero account that can deploy models, plus an API key for the code examples. The deployment GPU runs the models; your computer sends the requests.
- To measure a real business: a fixed camera observing the entrance, a frame capture process and a regularly sampled history. The QDivZero WebSocket can maintain tracking with ByteTrack. A photo tests detection; video lets you observe crossings.
For your first deployment, see the QDivZero quickstart. Follow the worked example before replacing the image, opening schedule and data with your own.
Decide what to measure
The workflow is video → YOLO26 and ByteTrack on QDivZero → entrance crossings → hourly arrivals → TimesFM 3.0 on QDivZero. The platform runs detection, maintains a tracker per session and serves forecasts. The example client captures frames, interprets crossings and prepares the numerical input for TimesFM.
Five visible people do not mean five new arrivals. A seated customer can appear in hundreds of frames. A still image also cannot tell you how many people entered over a day.
Arrival counts can include staff, delivery drivers and returning visitors. They are not automatically unique customers, bookings or sales. Decide what the counter represents and keep that definition consistent throughout evaluation.
Download the example materials
You need a QDivZero account that can deploy models, an API key if you want to write an integration, and a history sampled at regular intervals. For your own observations, begin with a fixed camera that can see the entrance and distinguish movement direction.
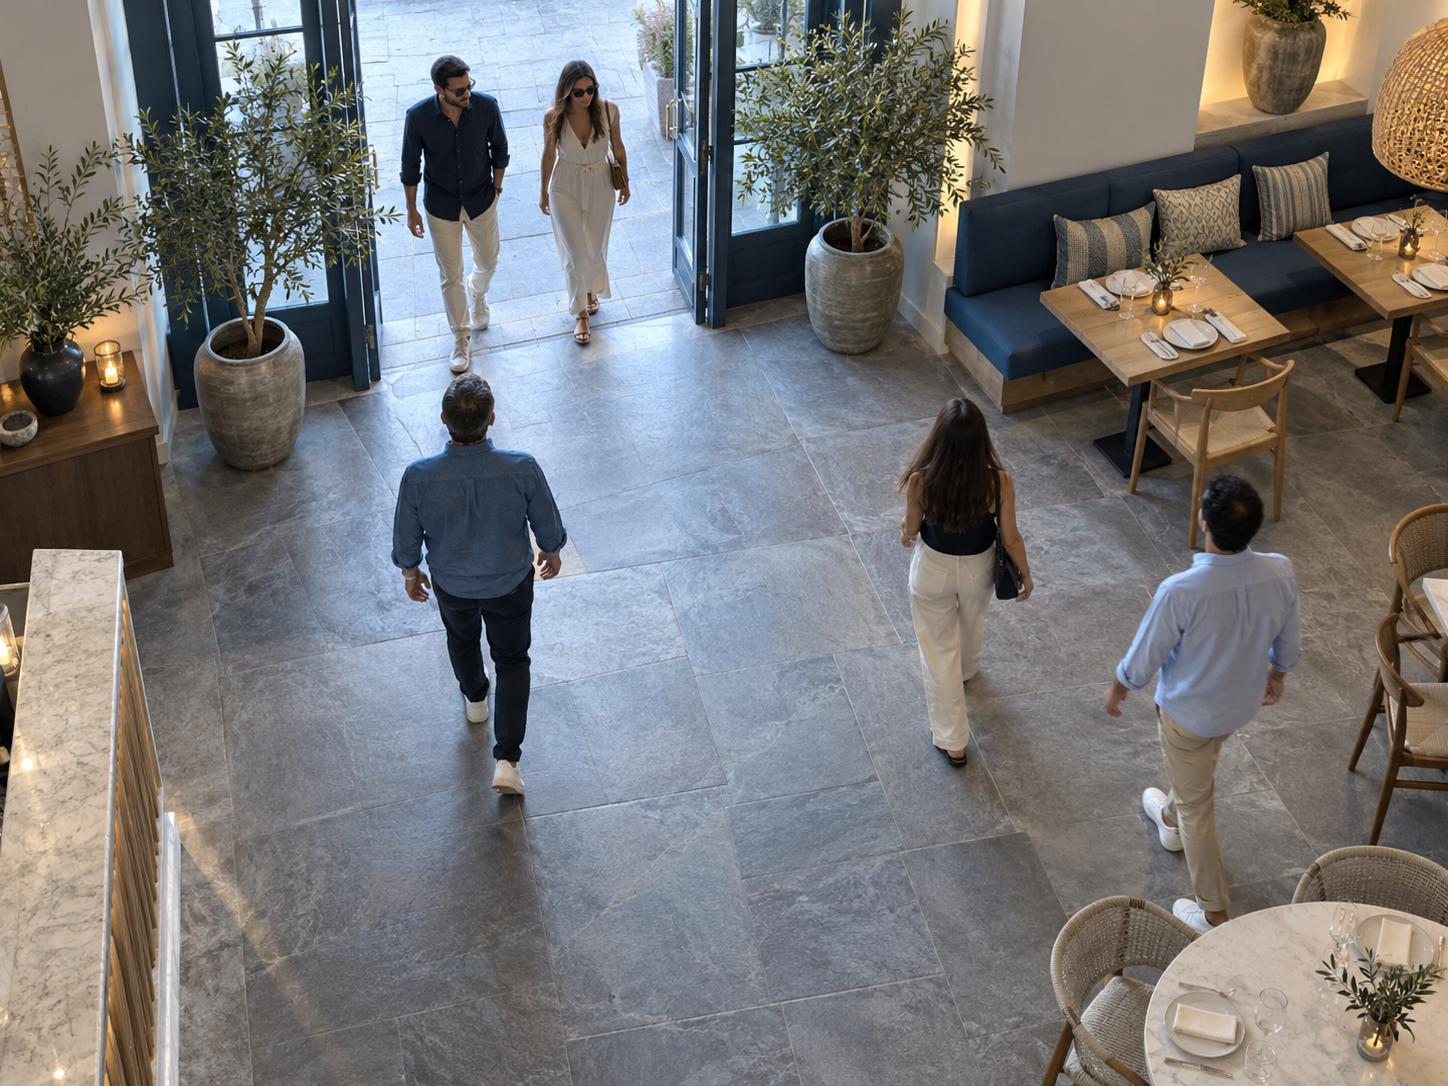
Download the test image · Download the synthetic history · Download the TimesFM request · Download the data generator · Download the Python CSV export example
The history contains 1,344 hourly observations covering 56 complete days. It includes lunch and dinner peaks, weekday differences and Monday closures. Each observation records UTC time, local time, arrivals, opening status and coverage. These are fictional, reproducible data. Save the files in one folder and open your terminal there to run the examples.
For a real camera, restrict the scene to the entrance you need to measure and retain only the information needed for analysis. Temporary tracking IDs and aggregate metrics can support counting without identifying individuals.
Deploy the models on QDivZero
Open Deployments → Model catalog and search for Ultralytics/YOLO26. Choose yolo26n.pt for an initial object detection test. You need a detector that includes person; a model fine-tuned for an unrelated domain will not provide a useful people counter. The Ultralytics documentation describes the model variants.
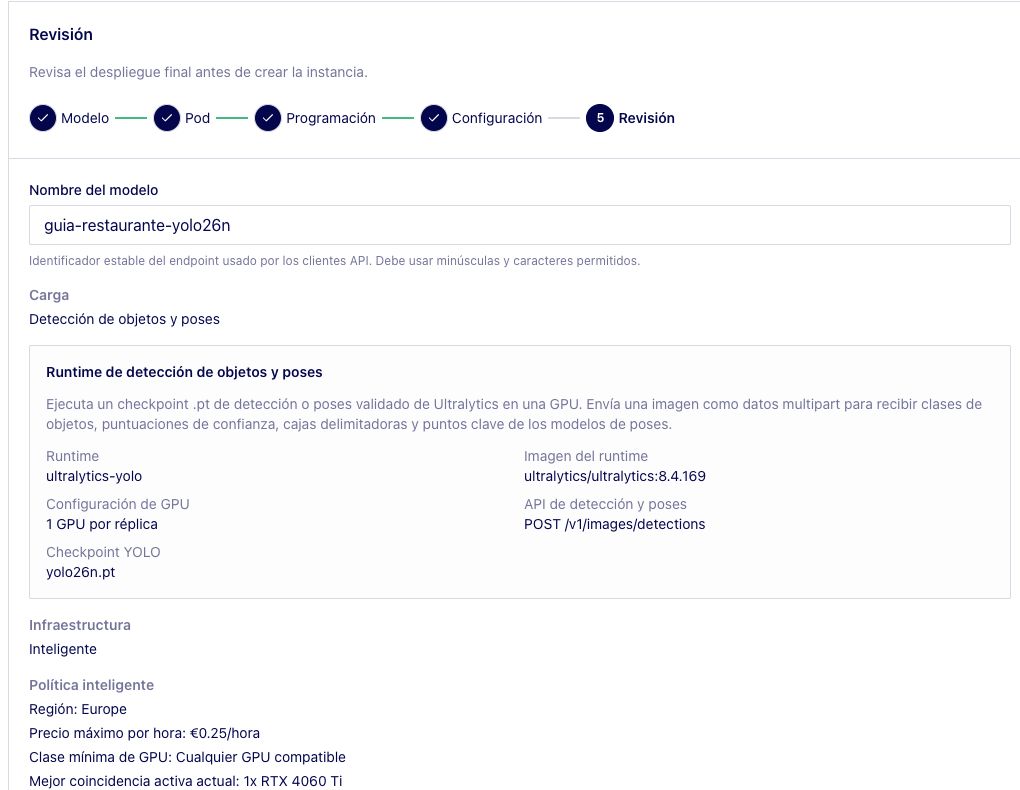
Choose compatible infrastructure. Smart scheduling lets you set a maximum hourly price; manual selection lets you choose a pod yourself. Check the current availability and price shown by the platform.
Give the deployment a recognizable name. Our API serving name is guia-restaurante-yolo26n. For a short test, enable Serverless with a 300-second idle timeout. The hourly price ceiling limits eligible offers; it does not cap total spending.
Repeat the process for google/timesfm-3.0-pytorch, using the timesfm3 runtime and the serving name guia-restaurante-timesfm3. The launch screen shows the runtime, estimated resource requirements and task endpoint.
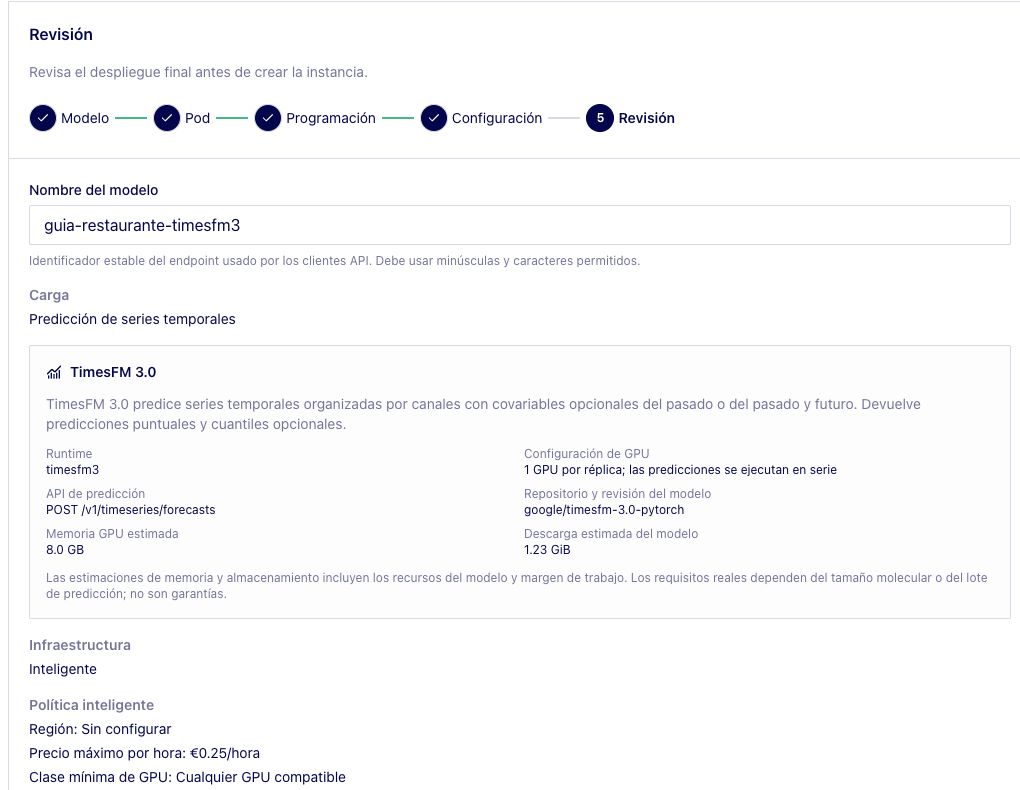
After creating a deployment, expand its row and choose Model status → Start model. Wait for readiness before using the first request as a performance measurement. Serverless endpoints may also start on demand, making the first request slower.
Users select the models they run on their GPU and need to review their terms. YOLO26 offers AGPL-3.0 and Enterprise licensing; downloaded TimesFM 3.0 weights carry a non-commercial license. Technical deployment through QDivZero does not replace permission for commercial use of the model.
Upload an image and check YOLO26 detections
In Developers, choose Object detection and pose estimation and select your YOLO26 endpoint. Open the Image tab and upload restaurant-example.png.
Run detection and compare each box with the original image. Record missed people, duplicate boxes and false positives. Change one option at a time and repeat with an empty entrance, groups, backlighting and occlusions.
This example execution returned five person detections, with confidence scores ranging from 80.4% to 90.5%.
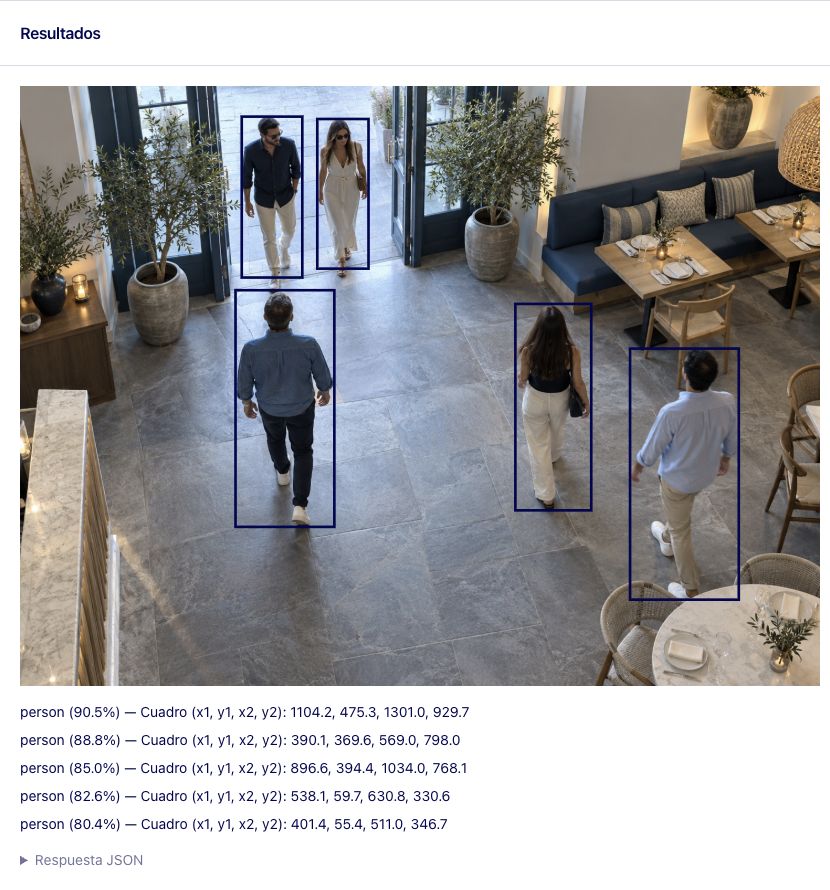
Download the original detection JSON
Make the same request from your application
View code shows the selected endpoint's request. Image detection uses multipart/form-data at POST /v1/images/detections. Keep the key on your server and replace the account ID and serving name with your own values.
1export QDIV0_API_KEY='YOUR_API_KEY'
2export QDIV0_ACCOUNT_ID='YOUR_ACCOUNT_ID'
3
4curl --fail-with-body --silent --show-error \
5  'https://api.qdiv0.com/v1/images/detections' \
6  -H "Authorization: Bearer ${QDIV0_API_KEY}" \
7  -H "X-Account-Id: ${QDIV0_ACCOUNT_ID}" \
8  --form-string 'model=guia-restaurante-yolo26n' \
9  --form-string 'confidence=0.25' \
10  --form-string 'iou=0.7' \
11  --form-string 'max_detections=300' \
12  --form-string 'image_size=640' \
13  --form-string 'classes=0' \
14  -F 'image=@restaurant-example.png' \
15  --output detections.json
16
This request detects objects in one image without preserving state. For video, enable tracking: true on the detection WebSocket: QDivZero maintains tracking across frames on that connection and returns track_id on confirmed detections.
Enable video tracking on QDivZero
Open Developers → Object detection and pose → Live video and select the same YOLO26 endpoint. Under Source, choose Video file to replay a recording or Camera to observe your entrance. Enable Track objects before pressing Start. Keep class 0 selected for this example's COCO detector.
The annotated view shows labels such as person #17. The number is a temporary ID within that connection. Some detections may omit an ID until the tracker confirms them. Compare one person's path across successive frames.
Tracking runs on QDivZero. The browser captures and sends frames; the runtime runs YOLO26 and updates an isolated ByteTrack tracker for the connection. With multiple replicas, the gateway keeps the first resolved replica for subsequent frames in that session, so the sequence reaches the same tracker.
How the WebSocket protocol works
View code generates examples with your selected model, account and options. To integrate a server-side Python client:
- Connect to
wss://api.qdiv0.com/v1/images/detections/stream?model=guia-restaurante-yolo26nwithAuthorization: Bearer YOUR_API_KEYand wait forsession.ready. - Send this configuration and wait for
session.configured:
1{
2  "type": "session.configure",
3  "options": {
4    "tracking": true,
5    "classes": [0],
6    "confidence": 0.25,
7    "iou": 0.7,
8    "image_size": 640,
9    "max_detections": 300
10  }
11}
12- Send each PNG/JPEG frame as one binary message. Wait for its
frame.resultbefore sending the next; keep frame dimensions fixed and preserve temporal order. - Use
result.detections[].track_idto associate a person's positions. Unconfirmed detections may omit the ID; wait for confirmation before starting a trajectory.
The client decodes the MP4: each binary message contains one image. The browser authenticates with its QDivZero session; the Python client uses an API key. QDivZero resolves the account and checks model access for every frame.
This is an example response format, not an additional execution performed for this guide:
1{
2  "type": "frame.result",
3  "frame_id": 1,
4  "processing_ms": 12,
5  "result": {
6    "model": "guia-restaurante-yolo26n",
7    "width": 1280,
8    "height": 720,
9    "detections": [{
10      "class_id": 0, "class_name": "person", "confidence": 0.91,
11      "track_id": 17,
12      "box": {"x1": 120, "y1": 40, "x2": 310, "y2": 680}
13    }]
14  }
15}
16
Boxes use pixels of the submitted frame. frame_id orders messages; retain capture time or source-video time to timestamp crossings. processing_ms measures the gateway inference call, including routing and network time to the instance, rather than GPU execution alone.
When an ID is preserved
Use one connection per camera and fixed frame dimensions. A track_id does not identify a person across cameras or days. A WebSocket session lasts at most 30 minutes; continuous integrations must renew it and record the tracking interruption.
Tracking requires support in the gateway, inference service and runtime. Restart existing YOLO deployments after updating the launcher. An older runtime that does not acknowledge the session returns an error instead of being accepted as valid tracking.
Turn trajectories into hourly arrival counts
The tracking API returns positions and IDs. Your entrance determines what arrival and departure mean: the example client configures a virtual line, records crossings and aggregates hours. This logic consumes QDivZero responses without running a local tracker.
Our counter uses each box's bottom center and a vertical line. Left → right is an arrival, and the reverse is a departure. A band spanning 2% of frame width on each side reduces changes caused by noise near the line. We wait to observe the ID on both sides, ignore unconfirmed IDs and allow departures and repeat visits. After more than one second of source-video time without observing a trajectory, we stop joining its positions.
Run the Python client on a recording
Download track_footfall.py and footfall_counter.py into the same folder. Use a local constant-frame-rate recording with a fixed camera and visible crossings. The first step's image only tests detection.
Keep QDIV0_API_KEY and QDIV0_ACCOUNT_ID from the first request and run:
1python3 -m venv .venv
2source .venv/bin/activate
3python -m pip install websocket-client opencv-python requests
4export QDIV0_DETECTION_MODEL='guia-restaurante-yolo26n'
5
6python track_footfall.py entrance.mp4 \
7  --recorded-at '2026-10-16T10:00:00+02:00' \
8  --line-x 0.5 --y-min 0.1 --y-max 0.9 \
9  --output camera-output
10
Replace the filename and --recorded-at with the actual time of its first frame. Coordinates are proportions between 0 and 1: this example uses a line halfway across the frame, from 10% to 90% of its height. The code processes every frame in order, waiting for each response; inference speed does not change the recording's timestamps. Use a new output folder for each run.
This is the integration's core; the downloadable files include authentication, errors, timestamps, resource cleanup and exports:
1from footfall_counter import LineCounter
2
3counter = LineCounter(line_x=0.5, y_min=0.1, y_max=0.9)
4# ws has already acknowledged session.configure with tracking=True.
5# encoded contains a JPEG; source_seconds is the source-video time.
6ws.send_binary(encoded.tobytes())
7event = receive(ws, "frame.result")
8for crossing in counter.observe(event["result"], source_seconds):
9    print(crossing["track_id"], crossing["direction"])
10
OpenCV only decodes video and encodes images. YOLO26 and ByteTrack run on QDivZero. The client needs neither Ultralytics nor model checkpoints.
Output files and the TimesFM handoff
The event ID lets storage deduplicate a retry of the same crossing. Preserve the identity namespace per session and allow later visits by the same track: someone may legitimately leave and return.
The client exports history after the entire recording finishes; errors leave partial logs for inspection. Coverage measures the processed span of that recording. Thirty seconds of video is not a full hour with zero arrivals. Partial hours retain coverage and stay out of the forecast request. Without a complete hour, the client saves metrics and explains why it did not create a forecast draft.
Once you have collected representative business cycles, paste camera-forecast-draft.json into Time series forecasting → Advanced JSON and select TimesFM. This file sends hourly arrivals without covariates; add future opening status only when the schedule is known. The code rejects internal gaps instead of compressing time.
Use the following step's eight synthetic weeks to practice forecasting now; they are independent of the video. The client stops on connection failure. A recording must finish processing within the session's 30-minute limit; continuous capture needs session renewal and recorded interruptions. Always compare counts with manual video review.
Use a UTC grid and convert to Europe/Madrid for business hours. An observed closure may have zero arrivals; a disconnected camera produces missing data. Occupancy requires an initial reference and coverage of every entrance.
Forecast the next 24 hours with TimesFM 3.0
TimesFM receives ordered numerical arrays. It does not receive the image or interpret timestamps from our history file; your application maintains the mapping between positions and hours. Here horizon: 24 means the following day. At 15-minute intervals, a day would require 96 steps.
Open Developers → Time series forecasting, select your TimesFM endpoint and switch to Advanced JSON. Paste forecast-draft.json and run the prediction. The endpoint selector supplies the serving name, so the downloadable draft omits model.
A covariate is additional information that can help forecasting. Opening status is 1 when open and 0 when closed, and its future schedule is known when predicting. If you add weather, use the weather forecast available at the prediction cutoff, not observations collected afterwards.
The form supports independent records. Target variables within one record are joint channels with equal history lengths. You can experiment with multiple entrances, provided their units agree and the channels do not double count the same people.
Send the history through the API
TimesFM uses POST /v1/timeseries/forecasts. This example adds the serving name to the draft and saves the unmodified response. Keep QDIV0_API_KEY and QDIV0_ACCOUNT_ID from the detection example in this terminal and check that forecast-draft.json is in the current folder.
On macOS or Linux, prepare an environment for requests:
1python3 -m venv .venv
2source .venv/bin/activate
3python -m pip install requests
4
Save the following code as forecast.py. The serving name must match your TimesFM deployment.
1import json
2import os
3from pathlib import Path
4
5import requests
6
7input_path = Path(os.environ.get("QDIV0_FORECAST_INPUT", "forecast-draft.json"))
8payload = json.loads(input_path.read_text())
9payload["model"] = os.environ.get("QDIV0_FORECAST_MODEL", "guia-restaurante-timesfm3")
10
11response = requests.post(
12    "https://api.qdiv0.com/v1/timeseries/forecasts",
13    headers={
14        "Authorization": f"Bearer {os.environ['QDIV0_API_KEY']}",
15        "X-Account-Id": os.environ["QDIV0_ACCOUNT_ID"],
16    },
17    json=payload,
18    timeout=(10, 600),
19)
20response.raise_for_status()
21result = response.json()
22Path("forecast-response.json").write_text(json.dumps(result, indent=2))
23print("Response saved to forecast-response.json")
24
To use your camera history, set export QDIV0_FORECAST_INPUT="camera-output/camera-forecast-draft.json" once that file exists. Leave the variable unset for the synthetic material.
Run it with python forecast.py. The expected result is a forecast-response.json file with 24 forecasts in predictions[0].forecast[0]. The number 24 describes the horizon, not the total expected arrivals.
Wait for readiness if the endpoint is still starting. Inspect the HTTP status and error message before retrying, and avoid accumulating identical requests while the GPU prepares.
Actual result on the example history
We executed this request on QDivZero and preserved the original response. The screenshot shows a completed forecast, with the submitted history followed by the 24 future steps.
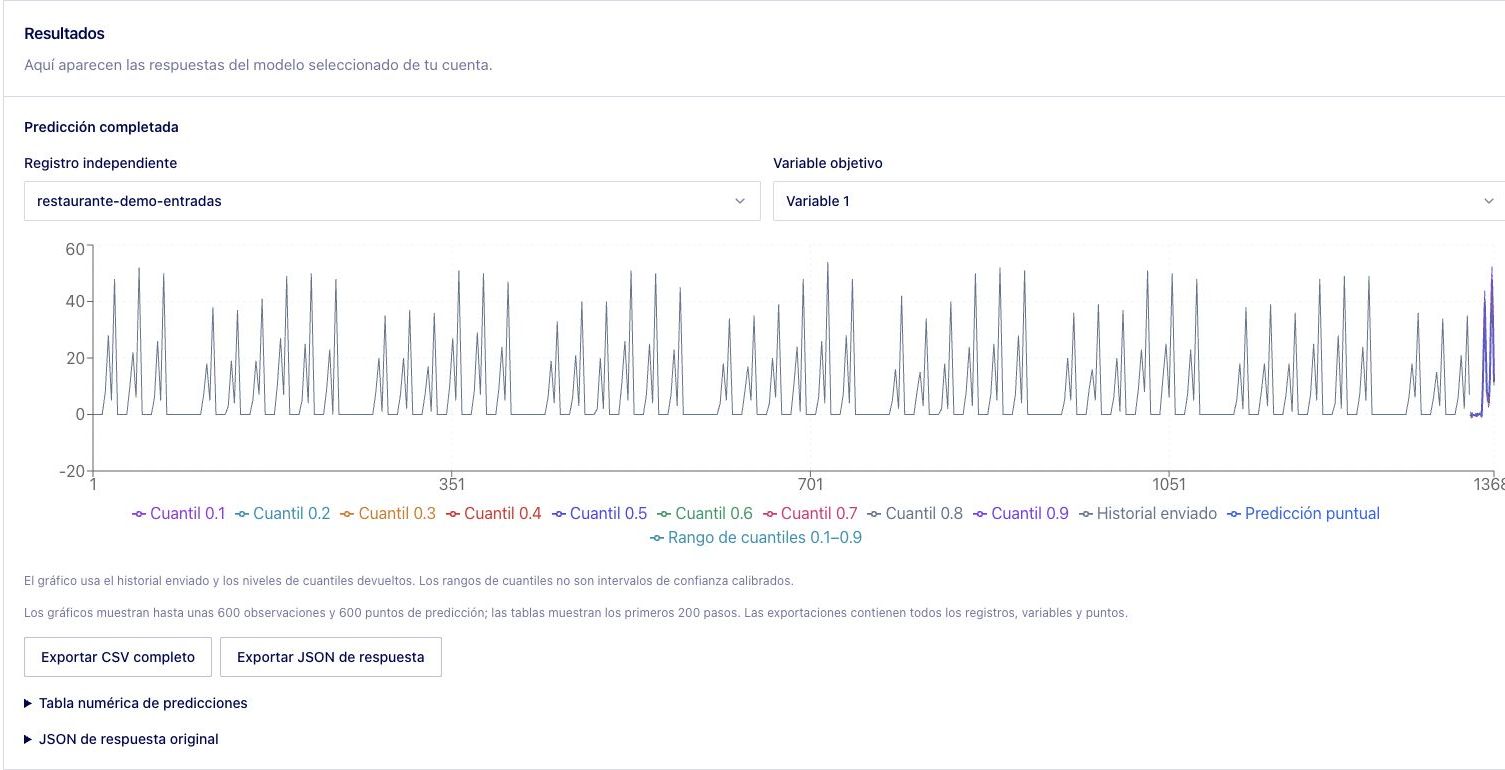
Selected hourly intervals starting on 16 October 2026 in Europe/Madrid, rounded to two decimals for this table:
Download the original execution response
In the JSON response, predictions[0].forecast[0] contains the first channel's 24 values. quantile_levels identifies the levels and predictions[0].quantiles[0] contains each step's quantiles. We preserve the small negative predictions returned for some closed hours to distinguish model output from dashboard adjustments.
Export the forecast to CSV with Python
To practise without deploying anything, download the history, detection JSON and forecast response linked in this guide. Save inspect_results.py in the same folder, then run:
1python3 inspect_results.py
2
Expected output for the example:
15 person detections (not arrival events)
224 forecasts -> footfall-forecast.csv
3
This is the downloadable file's code. It counts person detections, locates P10 and P90 by their levels and calculates timestamps from the last observed interval. It only reads local files: it makes no requests and starts no GPU.
1import csv
2import json
3from datetime import datetime, timedelta
4from pathlib import Path
5from zoneinfo import ZoneInfo
6
7
8def main():
9    history = json.loads(Path("history.json").read_text(encoding="utf-8"))
10    detection = json.loads(Path("detection-response.json").read_text(encoding="utf-8"))
11    response = json.loads(Path("forecast-response.json").read_text(encoding="utf-8"))
12
13    people = sum(item["class_name"] == "person" for item in detection["detections"])
14    print(f"{people} person detections (not arrival events)")
15
16    prediction = response["predictions"][0]
17    p10 = response["quantile_levels"].index(0.1)
18    p90 = response["quantile_levels"].index(0.9)
19    interval = timedelta(seconds=history["interval_seconds"])
20    complete = [row for row in history["observations"] if row["coverage"] == 1]
21    if not complete:
22        raise ValueError("No complete observed hour for the forecast cutoff")
23    last = datetime.fromisoformat(complete[-1]["timestamp_utc"])
24    local_zone = ZoneInfo(history["timezone"])
25
26    with Path("footfall-forecast.csv").open("w", newline="", encoding="utf-8") as output:
27        writer = csv.writer(output)
28        writer.writerow(["timestamp_utc", "timestamp_local", "forecast", "p10", "p90"])
29        for step, value in enumerate(prediction["forecast"][0]):
30            timestamp = last + (step + 1) * interval
31            quantiles = prediction["quantiles"][0][step]
32            writer.writerow([
33                timestamp.isoformat(), timestamp.astimezone(local_zone).isoformat(),
34                value, quantiles[p10], quantiles[p90],
35            ])
36
37    print(f"{len(prediction['forecast'][0])} forecasts -> footfall-forecast.csv")
38
39
40if __name__ == "__main__":
41    main()
42
Open footfall-forecast.csv in your spreadsheet or dashboard. It has 24 rows with UTC time, local time, point forecast, P10 and P90, preserving precision and negative values. The first interval starts at 00:00 on 16 October 2026 in Europe/Madrid. For your own runs, always use the history that produced that response, with the same interval and channel order.
Interpret forecasts before planning service
Compare recent observations with the forecast, checking opening hours, lunch and dinner peaks and the same weekday a week earlier. Decimal predictions express estimated arrivals rather than literal fractions of a person.
Preserve the raw response for evaluation. If your dashboard rounds values or applies max(0, forecast), record that transformation. You can impose zero during known closures as a business rule, while evaluating the raw model and the adjusted result separately.
Quantiles help explore scenarios. A P10–P90 band does not by itself guarantee 80% coverage at your business. Measure coverage on later observations. Do not add hourly P90 values and label the sum as the daily P90; quantiles do not aggregate that way.
Combine expected arrivals with visit duration, venue capacity and operational experience when planning staffing and facilities. In the worked restaurant example, table capacity also matters. Arrivals per hour and simultaneous occupancy have different meanings. Synthetic examples demonstrate the workflow, not forecasting accuracy at a real business.
Check whether it beats a simple baseline
Hold out the final seven days. At each cutoff, use only earlier observations and forecast the next 24 hours. Compare TimesFM with the same hour on the same weekday one week earlier.
Evaluate several days and retain the history, model, parameters and prediction time. If the weekly baseline wins, keep using it while improving the data or configuration. Model complexity does not guarantee a better forecast.
Run the workflow and control resources
For continuous collection, each camera uses its own QDivZero tracking WebSocket. The client records crossings and closes intervals; an application task sends the history to TimesFM. Store timestamps, configuration and coverage alongside metrics. The downloadable example processes recordings; a permanent camera integration also needs reconnection and observation-window management.
You can keep YOLO available during observation hours and run TimesFM in batches before opening or planning the next shift. Measure frame frequency, latency and cost using your camera before selecting a larger pod. A crossing counter needs enough temporal detail to observe movements; sampling too slowly can miss them.
After testing, use Deployments → Model status → Shut down model for the resources you used. Serverless helps stop idle resources, but verify their status. Keep API keys in your backend and review View code whenever you change task or endpoint.
Frequently asked questions about people counting with cameras
Does this work for shops, gyms and other physical businesses?
Yes, provided the cameras can observe entrances and distinguish crossings. Adapt camera placement, opening schedules and the definition of an arrival. Occupancy estimates require coverage of every entrance and a known initial occupancy.
Do I need to install YOLO26 and TimesFM on my computer?
YOLO26, ByteTrack and TimesFM run in QDivZero deployments. Your computer only needs the client tools: OpenCV for reading video, a WebSocket library for sending frames, and the Python counter for interpreting crossings. You do not need model checkpoints locally.
Can one photo tell me how many people arrived that day?
A photo shows visible people at one instant. Measuring arrivals requires tracking movement across frames and recording inward crossings. TimesFM uses the aggregated event history; it does not turn an image into a visitor forecast.
How much history do I need to forecast footfall?
This tutorial uses eight weeks of hourly data as a reproducible starting point. That is neither a universal minimum nor an accuracy guarantee. Collect representative business cycles and evaluate later days, especially holidays, schedule changes and peak hours.
Does QDivZero tracking count unique customers?
It returns temporary IDs within a connection. The counter measures entrance crossings, which may include employees, couriers and repeat visits. Validate the metric against representative video before using it for business planning.
Sources and materials
- YOLO26 tasks and variants, Ultralytics.
- Object tracking and trackers, Ultralytics.
- Official TimesFM code and examples.
- TimesFM 3.0 model card and license, Google.
Screenshots were captured from the actual QDivZero interface. The scene and history are synthetic teaching materials. Request contracts follow the platform form and its generated code examples.